ICT GMMA VegasHigh-Level Summary
This indicator blends:
ICT concepts (Market Structure Shift, Break of Structure, Order Blocks, Liquidity Pools, Fair Value Gaps, Killzones, etc.).
GMMA (Guppy Multiple Moving Averages) to visualize short, medium, and long trend strength.
Vegas Tunnels (EMA channels 144/169 and 576/676, plus optional 288/388 mid-tunnels).
Vegas Touch entry module with candlestick patterns (Pin Bar 40%, Engulfing 60%).
Extra slope EMAs (EMA60 & EMA200 with color change by slope).
It not only shows the structure (OB, Liquidity, FVGs) but also plots entry arrows and alerts when Vegas Touch + GMMA align.
⚙️ Script Components
1. GMMA Visualization
Short-term EMAs (3–15, green).
Medium-term EMAs (30–60, red).
Long-term EMAs (100–250, blue).
Used to measure crowd sentiment: short EMAs = traders, long EMAs = investors.
The script counts how many EMAs the close is above/below:
If close above ≥17 → possible buy trend.
If close below ≥17 → possible sell trend.
Plots arrows for buy/sell flips.
2. Vegas Tunnels
Short-term tunnel → EMA144 & EMA169.
Long-term tunnel → EMA576 & EMA676.
Mid-tunnels → EMA288 & EMA388.
Plotted as orange/fuchsia/magenta bands.
Conditions:
Breakout checks → if close crosses above/below these EMAs compared to prior bar.
3. ICT Toolkit
Market Structure Shift (MSS) & BOS (Break of Structure): labels & dotted lines when price shifts trend.
Liquidity zones (Buy/Sell): boxes drawn around swing highs/lows with clustering.
Fair Value Gaps (FVG/IFVG): automatic box drawing, showing break status.
Order Blocks (OB): bullish/bearish blocks, breaker OB recognition.
Killzones: highlights NY open, London open/close, Asia session with background shading.
Displacement: plots arrows on large impulse candles.
NWOG/NDOG: Weekly/Monday Open Gaps.
Basically, this section gives a full ICT price action map on the chart.
4. Vegas Touch Entry Module (Pin40/Eng60 + EMA12 switch)
This is the custom entry system you added:
Logic:
If EMA12 > EMA169, use Tunnel (144/169) as reference.
If EMA12 ≤ EMA169, use Base (576/676).
Hard lock: no longs if EMA12 < EMA676; no shorts if EMA12 > EMA676.
Touch condition:
Long → price touches lower band (Tunnel/Base).
Short → price touches upper band (Tunnel/Base).
With ATR/Percent tolerance.
Trend filter:
Must also align with long-term Vegas direction (144/169 vs 576/676 cross).
Close must be on the outer side of the band.
Candlestick filter:
Pin Bar (≥40% wick) or
Engulfing (≥60% bigger body than previous).
Cooldown: avoids multiple signals in short succession.
Plots:
Green triangle below = Long entry.
Red triangle above = Short entry.
Alerts: triggers once per bar close with full message.
5. Slope EMAs (Extra)
EMA60 and EMA200 plotted as thick lines.
Color:
Green if sloping upward (current > value 2 bars ago).
Red if sloping downward.
📡 Outputs & Alerts
Arrows for GMMA trend flips.
Arrows for Vegas Touch entries.
Labels for MSS, BOS, FVGs, OBs.
Liquidity/FVG/OB boxes.
Background shading for killzones.
Alerts:
“📡 Entry Alert (Long/Short)” for GMMA.
“VT LONG/SHORT” for Vegas Touch.
📝 Key Idea
This is not just one system, but a multi-layered confluence tool:
ICT structure & liquidity context.
GMMA trend recognition.
Vegas Tunnel directional bias.
Candlestick-based confirmation (Pin/Engulf).
Alert automation for live trading.
👉 It’s essentially a trader’s dashboard: structural map + moving averages + entry signals all in one.
Search in scripts for "Buy sell"

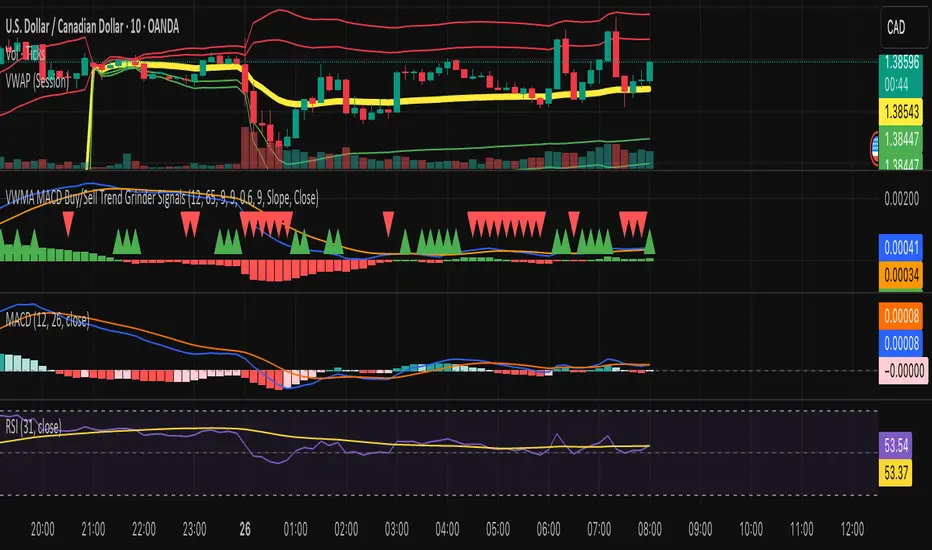
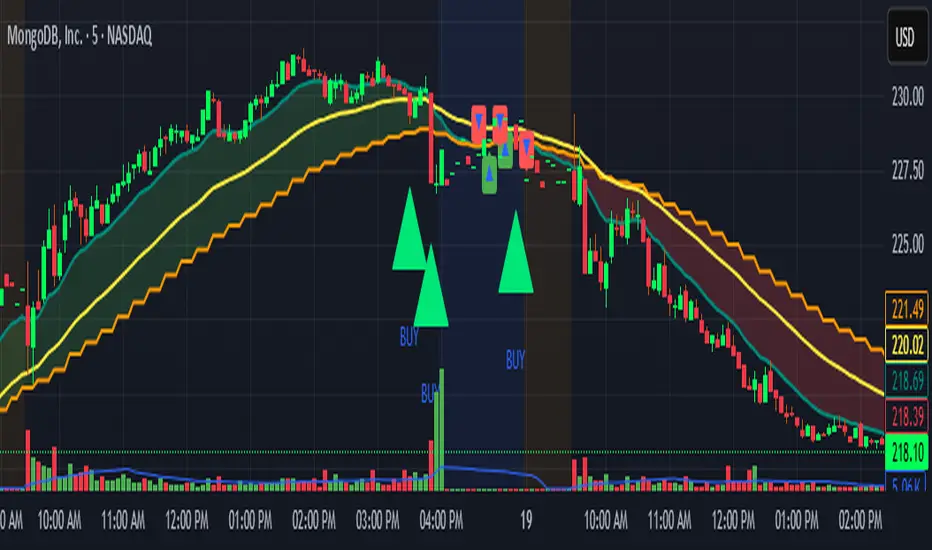
VWMA MACD Trend Grinder Buy/Sell SignalsDescription:
This indicator combines a VWMA-based MACD with volume and trend filters to reduce false buy and sell signals.
It is designed to give more reliable entry and exit points in trending markets while avoiding low-volume noise.
Features:
1. VWMA MACD:
- MACD is calculated using Volume-Weighted Moving Averages (VWMA) instead of standard EMAs.
- Histogram shows the difference between MACD and its signal line.
2. Volume Filter:
- Signals are only triggered when current volume exceeds a multiple of its moving average.
- Reduces false signals in low-volume periods.
3. Trend Filter:
- Only triggers buy signals when price is above a long-term VWMA (uptrend).
- Only triggers sell signals when price is below the long-term VWMA (downtrend).
- Helps avoid counter-trend trades.
4. Plots:
- MACD (blue), Signal (orange), Histogram (green/red)
- Trend VWMA (purple)
- Buy and Sell arrows in the indicator pane (green/red)
5. Alerts:
- Configurable alerts for buy and sell signals filtered by volume and trend.
Inputs:
- Fast Length: VWMA period for the fast MACD line (default 12)
- Slow Length: VWMA period for the slow MACD line (default 26)
- Signal Length: EMA period for the MACD signal line (default 9)
- Volume MA Length: Length for volume moving average filter (default 20)
- Volume Threshold Multiplier: Multiplier for volume filter (default 1.2)
- Trend VWMA Length: Period for long-term trend VWMA (default 50)
- Price Source: Close, HL2, HLC3, OHLC4
Usage:
- Use as a confirmation tool along with other analysis techniques.
- Buy when the green triangle appears (MACD crossover, above trend VWMA, sufficient volume).
- Sell when the red triangle appears (MACD crossunder, below trend VWMA, sufficient volume).
- Trend VWMA helps visually confirm the market trend.
EdgeFlow Pullback [CHE]EdgeFlow Pullback \ — Icon & Visual Guide (Deep Dive)
TL;DR (1-minute read)
⏳ Hourglass = Pending verdict. A countdown runs from the signal bar until your Evaluation Window ends.
✔ Checkmark (green) = OK. After the evaluation window, price (HLC3) is on the correct side of the EMA144 for that signal’s direction.
✖ Cross (red) = Fail. After the evaluation window, price (HLC3) is on the wrong side of the EMA144.
▲ / ▼ Triangles = the actual PB Long/Short signal bar (sequence completed in time).
Small lime/red crosses = visual markers when HLC3 crosses EMA144 (context, not trade signals).
Orange line = EMA144 (baseline/trend filter).
T3 line color = Context signal: green when T3 is below HLC3, red when T3 is above HLC3.
Icon Glossary (What each symbol means)
1) ⏳ Hourglass — “Pending / Countdown”
Appears immediately when a PB signal fires (Long or Short).
Shows `⏳ currentBars / EvaluationBars` (e.g., `⏳ 7/30`).
The label stays anchored at the signal bar and its original price level (it does not drift with price).
During ⏳ you get no verdict yet. It’s simply the waiting period before grading.
2) ✔ Checkmark (green) — “Condition met”
Appears after the Evaluation Window completes.
Logic:
Long signal: HLC3 (typical price) is above EMA144 → ✔
Short signal: HLC3 is below EMA144 → ✔
The label turns green and text says “✔ … Condition met”.
This is rules-based grading, not PnL. It tells you if the post-signal structure behaved as expected.
3) ✖ Cross (red) — “Condition failed”
Appears after the Evaluation Window completes if the condition above is not met.
Label turns red with “✖ … Condition failed”.
Again: rules-based verdict, not a guarantee of profit or loss.
4) ▲ “PB Long” triangle (below bar)
Marks the exact bar where the 4-step Long sequence completed within the allowed window.
That bar is your signal bar for Long setups.
5) ▼ “PB Short” triangle (above bar, red)
Same as above, for Short setups.
6) Lime/Red “+” crosses (tiny cross markers)
Lime cross (below bar): HLC3 crosses above EMA144 (crossover).
Red cross (above bar): HLC3 crosses below EMA144 (crossunder).
These crosses are context markers; they’re not entry signals by themselves.
The Two Clocks (Don’t mix them up)
There are two different time windows at play:
1. Signal Window — “Max bars for full sequence”
A pullback signal (Long or Short) only fires if the 4-step sequence completes within this many bars.
If it takes too long: reset (no signal, no triangle, no label).
Purpose: avoid stale setups.
2. Evaluation Window — “Evaluation window after signal (bars)”
Starts after the signal bar. The label shows an ⏳ countdown.
When it reaches the set number of bars, the indicator checks whether HLC3 is on the correct side of EMA144 for the signal direction.
Then it stamps the signal with ✔ (OK) or ✖ (Fail).
Timeline sketch (Long example):
```
→ ▲ PB Long at bar t0
Label shows: ⏳ 0/EvalBars
t0+1, t0+2, ... t0+EvalBars-1 → still ⏳
At t0+EvalBars → Check HLC3 vs EMA144
Result → ✔ (green) or ✖ (red)
(Label remains anchored at t0 / signal price)
```
What Triggers the PB Signal (so you know why triangles appear)
LONG sequence (4 steps in order):
1. T3 falling (the pullback begins)
2. HLC3 crosses under EMA144
3. T3 rising (pullback ends)
4. HLC3 crosses over EMA144 → PB Long triangle
SHORT sequence (mirror):
1. T3 rising
2. HLC3 crosses over EMA144
3. T3 falling
4. HLC3 crosses under EMA144 → PB Short triangle
If steps 1→4 don’t complete in time (within Max bars for full sequence), the sequence is abandoned (no signal).
Lines & Colors (quick interpretation)
EMA144 (orange): your baseline trend filter.
T3 (green/red):
Green when T3 < HLC3 (price above the smoothed path; often supportive in up-moves)
Red when T3 > HLC3 (price below the smoothed path; often pressure in down-moves)
HLC3 (gray): the typical price the logic uses ( (H+L+C)/3 ).
Label Behavior (anchoring & cleanup)
Each signal creates one label at the signal bar with ⏳.
The label is position-locked: it stays at the same bar index and y-price it was born at.
After the evaluation check, the label text and color update to ✔/✖, but position stays fixed.
The indicator keeps only the last N labels (your “Show only the last N labels” input). Older ones are deleted to reduce clutter.
What You Can (and Can’t) Infer from ✔ / ✖
✔ OK: Structure behaved as intended during the evaluation window (HLC3 finished on the correct side of EMA144).
Inference: The pullback continued in the expected direction post-signal.
✖ Fail: Structure ended up opposite the expectation.
Inference: The pullback did not continue cleanly (chop, reversal, or insufficient follow-through).
> Important: ✔/✖ is not profit or loss. It’s an objective rule check. Use it to identify market regimes where your entries perform best.
Input Settings — How they change the visuals
T3 length:
Shorter → faster turns, more signals (and more noise).
Longer → smoother turns, fewer but cleaner sequences.
T3 volume factor (0–1, default 0.7):
Higher → more curvature/smoothing.
Typical sweet spot: 0.5–0.9.
EMA length (baseline) default 144:
Smaller → faster baseline, more cross events, more aggressive signals.
Larger → slower, stricter trend confirmation.
Max bars for full sequence (signal window):
Smaller → only fresh, snappy pullbacks can signal.
Larger → allows slower pullbacks to complete.
Evaluation window (after signal):
Smaller → verdict arrives quickly (less tolerance).
Larger → gives the trade more time to prove itself structurally.
Show only the last N labels:
Controls chart clutter. Increase for more history, decrease for focus.
(FYI: The “Debug” toggle exists but doesn’t draw extra overlays in this version.)
Practical Reading Flow (how to use visuals in seconds)
1. Triangles catch your eye: ▲ for Long, ▼ for Short. That’s the setup completion.
2. ⏳ label starts—don’t judge yet; let the evaluation run.
3. Watch EMA slope and T3 color for context (trend + pressure).
4. After the window: ✔/✖ stamps the outcome. Log what the market was like when you got ✔.
Common “Why did…?” Questions
Q: Why did I get no triangle even though T3 turned and EMA crossed?
A: The 4 steps must happen in order and within the Signal Window. If timing breaks, the sequence resets.
Q: Why did my label stay ⏳ for so long?
A: That’s by design until the Evaluation Window completes. The verdict only happens at the end of that window.
Q: Why is ✔/✖ different from my PnL?
A: It’s a structure check, not a profit check. It doesn’t know your entries/exits/stops.
Q: Do the small lime/red crosses mean buy/sell?
A: No. They’re context markers for HLC3↔EMA crosses, useful inside the sequence but not standalone signals.
Pro Tips (turn visuals into decisions)
Entry: Use the ▲/▼ triangle as your trigger, in trend direction (check EMA slope/market structure).
Stop: Behind the pullback swing around the signal bar.
Exit: Structure levels, R-multiples, or a reverse HLC3↔EMA cross as a trailing logic.
Tuning:
Intraday/volatile: shorter T3/EMA + tighter Signal Window.
Swing/slow: default 144 EMA + moderate windows.
Learn quickly: Filter your chart to show only ✔ or only ✖ windows in your notes; see which sessions, assets, and volatility regimes suit the system.
Disclaimer
No indicator guarantees profits. Sweep2Trade Pro \ is a decision aid; always combine with solid risk management and your own judgment. Backtest, forward test, and size responsibly.
The content provided, including all code and materials, is strictly for educational and informational purposes only. It is not intended as, and should not be interpreted as, financial advice, a recommendation to buy or sell any financial instrument, or an offer of any financial product or service. All strategies, tools, and examples discussed are provided for illustrative purposes to demonstrate coding techniques and the functionality of Pine Script within a trading context.
Any results from strategies or tools provided are hypothetical, and past performance is not indicative of future results. Trading and investing involve high risk, including the potential loss of principal, and may not be suitable for all individuals. Before making any trading decisions, please consult with a qualified financial professional to understand the risks involved.
By using this script, you acknowledge and agree that any trading decisions are made solely at your discretion and risk.
Enhance your trading precision and confidence 🚀
Happy trading
Chervolino

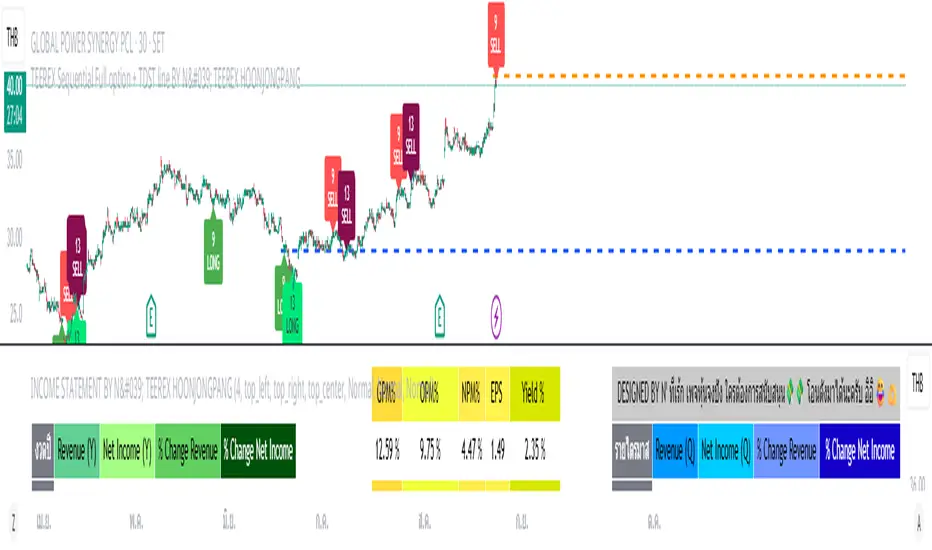
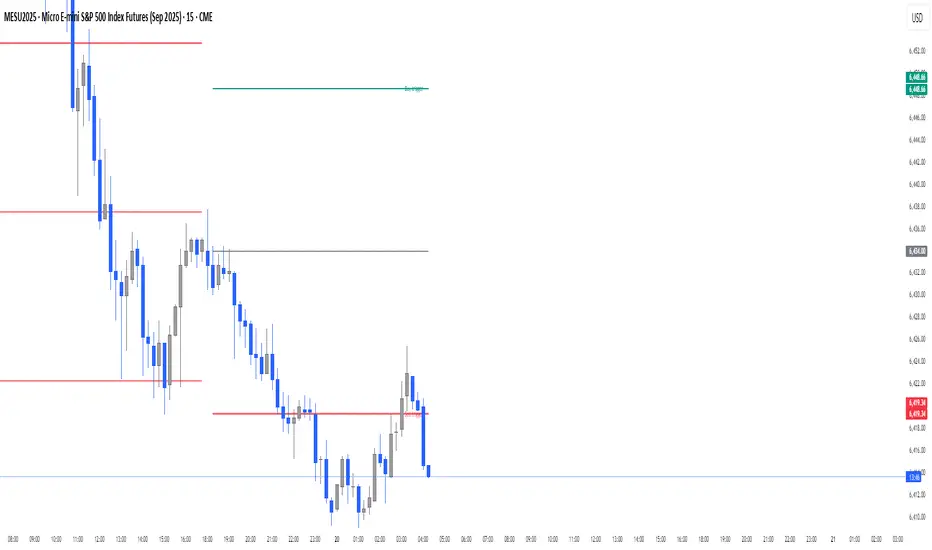
TEEREX COUNTDOWN BY N' TEEREX HOONJONGPANG Features:
Price Flip Detection – identifies initial buy/sell setups based on close price comparisons to previous bars.
Setup Phase (1–9) – counts consecutive bars fulfilling Teerex number conditions; plots numbers on each candle.
Cd Phase (1–13) – continues counting after Setup 9; highlights potential reversal points.
Signals – marks Setup 9 and Countdown 13 with clear labels and arrows (“LONG” / “SELL”).
TDST Lines – draws dynamic support (Buy TDST) or resistance (Sell TDST) lines based on Setup 9 highs/lows. These lines help identify potential breakout or bounce zones.
Customizable Display – options to show/hide numbers, signals, and TDST lines; color-coded for clarity.
Usage:
Monitor Setup 9 and Countdown 13 labels for strong buy/sell signals.
Use TDST lines as reference for support/resistance, target levels, or confirmation of trend continuation.
Visuals:
Numbers 1–9/1–13 appear on the chart for precise counting.
Arrows and labels indicate Setup 9 completion and Cd 13 completion.
TDST lines extend to the right, updating with each new Setup 9.

Volume Spikes + Daily VWAP SD BandsVolume Spikes + Daily VWAP SD Bands
This indicator combines volume spike detection to help traders identify potential absorption zones with daily VWAP and standard deviation bands , key price levels, continuation opportunities, and possible institutional bias.
Features:
Volume Spike Detection
Highlights candles with unusually high volume relative to a configurable SMA.
Optional filters:
Local highs/lows only (Only Use Valid Highs & Lows)
Candle shapes: Hammer / Shooter only
Candle color match: bullish spikes on green, bearish on red
Plots small circles above/below bars for bullish and bearish volume spikes.
Alerts available for both bullish and bearish spikes.
Interpretation: Volume spikes at local highs/lows can indicate absorption, where one side absorbs aggressive buying/selling pressure.
Daily VWAP
Calculates volume-weighted average price (VWAP) for the current day.
Optionally shows previous day’s VWAP for reference.
Plot lines are customizable with optional circles on lines for visual clarity.
Labels on the last bar show exact VWAP values.
Institutional Bias Insight: Price above both current and previous VWAPs may indicate bullish positioning; price below both VWAPs may indicate bearish positioning. Many professional traders consider this a clue to institutional bias, but it’s not guaranteed. Always confirm with volume, delta, or orderflow analysis.
Standard Deviation Bands
Optional x1 and x2 SD bands around the daily VWAP.
Visual fill between bands shows price volatility zones.
Can be used to identify potential support/resistance or absorption zones.
Use Case: Price bounces off first SD band may indicate continuation signals, especially when volume spikes occur at those levels.
Customizable Visuals
Colors for bullish and bearish volume spikes
VWAP and SD band colors and thickness
Optional circles and filled bands for better readability
Alerts
Bullish / Bearish Volume Spikes
Supports TradingView alert system for automated notifications
Advanced Use Cases:
Combine with Cumulative Delta or Orderflow tools to confirm true absorption zones.
Identify high-volume rejection candles signaling possible trend continuation.
Use VWAP positioning relative to price to assess potential institutional bias, keeping in mind it is probabilistic, not guaranteed.
Visualize intraday VWAP levels and volatility with SD bands for better trade timing.
Settings: Fully customizable, including volume multiplier, SMA length, session filter, candle shape, color options, and VWAP/SD display preferences.

Sweep2Trade Pro [CHE]Sweep2Trade Pro \ — Liquidity Sweep → Trend → Confirmation
Sweep2Trade Pro \ helps you catch high-probability reversals or continuations that start with a liquidity sweep, align with the T3 trend, and finalize with a structure confirmation (BOS). It’s designed to reduce noise, time your entries, and keep you out of weak, chop-driven signals.
What’s a “sweep”?
A liquidity sweep happens when price briefly breaks a prior swing high/low (where many stops sit), triggers those stops, and then snaps back. This “stop-hunt” creates liquidity for bigger players and often precedes a sharp move in the opposite direction if the break fails, or fuels continuation if structure actually shifts.
What’s a BOS (Break of Structure)?
A BOS is a price action event where the market takes out a recent swing level in the trend’s direction, signaling continuation and confirming that structure has shifted (bullish BOS through a recent swing high, bearish BOS through a recent swing low).
How the indicator works (at a glance)
1. Regime Filter (T3 + R²)
T3 Moving Average: A smoother, faster-responding moving average that aims to reduce lag while filtering noise, so trend direction changes are clearer.
R² (Coefficient of Determination): Measures how “linear” the recent price path is (0→1). Higher values = stronger, cleaner trend; lower values = more chop. Used here to allow trades only when trend quality exceeds a user-set threshold.
2. Sweep Detection
Bullish sweep: price pokes below a prior swing low and closes back above it.
Bearish sweep: price pokes above a prior swing high and closes back below it.
Lookback length is configurable.
3. Sequence Lock (built-in FSM)
The script manages state in phases so you don’t jump the gun:
Phase 1: Sweep detected → wait for T3 to turn in the corresponding direction.
Phase 2: T3 direction confirmed → show “SWEEP OK” and wait for final confirmation.
Trade Signal: Only fires if confirmation arrives before a timeout.
4. Confirmation Layer
BOS via wick or close (you choose),
Strong close toward the signal (top/bottom quartile of the candle),
Optional “close above/below T3” condition.
These checks help avoid weak sweeps that immediately fade.
5. Alerts & Visuals
“SWEEP OK” markers show when the sweep + T3 direction align.
Final BUY/SELL arrows appear only when the confirmation layer passes.
Ready-made alert conditions for automation.
What you can do with it
Time reversals after sweeps: Enter when a stop-hunt fades and structure confirms.
Ride continuations: Use BOS with the T3 trend to pyramid or re-enter with structure on your side.
Filter chop: Let R² gate entries to periods with cleaner directional drift.
Automate: Use the included alerts with your platform or webhook setup.
Inputs (key settings)
Regime Filter
T3 Length / Volume Factor: Controls smoothness and responsiveness. Smaller length → faster, more sensitive; higher volume factor → smoother curve.
R² Lookback & Threshold: Length of the linear fit window and the minimum “trend quality” required. Higher thresholds mean fewer, cleaner signals.
Sweep / Sequence
Swing Lookback: How far back to define the “reference” high/low for sweeps.
Timeout: Maximum bars allowed between phases to keep signals fresh.
Restart timeout on Phase 2: Optional safety so entries don’t go stale.
Confirmation
BOS Lookback: Micro-pivot window for structure breaks.
Wick vs Close BOS: Conservative traders may prefer close.
Require close above/below T3: Tightens confirmation with trend alignment.
Practical guide (quick start)
1. Timeframe & markets: Works across majors, indices, and crypto. Start with 5m–1h intraday or 1h–4h swing; adjust R² threshold upward on noisier pairs.
2. Entry recipe (Long):
Bullish sweep of a prior low → T3 turns up → BOS/strong close.
Optional: enable “close above T3” for extra confirmation.
3. Entry recipe (Short): Mirror the above.
4. Stops: Common choices are just beyond the sweep wick (tighter) or past the BOS invalidation (safer).
5. Targets: Previous structural levels, measured move, or a T3 trail (exit when price closes back through T3).
6. Avoid low-quality contexts: If R² is very low, market is likely ranging erratically—skip or widen filters.
Tips & best practices
Context first: The same sweep means different things in a strong trend vs. flat regime; that’s why the T3+R² filter exists.
BOS choice: Wick-based BOS is earlier but noisier; close-based BOS is slower but cleaner. Tune per market.
Backtest -> Forward test: Validate settings per symbol/timeframe; then paper trade before going live.
Risk: Fixed fractional risk with asymmetric R\:R (e.g., 1:1.5–1:3) generally performs better than “all-in” discretionary sizing.
Behind the scenes (for the curious)
T3 is a multi-stage EMA construction that produces a smooth curve with reduced lag versus simple/standard EMAs.
R² is the square of correlation (0–1). Here it’s used as a moving gauge of how well price aligns to a linear path—our “trend quality” dial.
Stop-hunts / sweeps are a recognized microstructure phenomenon where clustered stops provide the liquidity that fuels the next move.
Disclaimer
No indicator guarantees profits. Sweep2Trade Pro \ is a decision aid; always combine with solid risk management and your own judgment. Backtest, forward test, and size responsibly.
The content provided, including all code and materials, is strictly for educational and informational purposes only. It is not intended as, and should not be interpreted as, financial advice, a recommendation to buy or sell any financial instrument, or an offer of any financial product or service. All strategies, tools, and examples discussed are provided for illustrative purposes to demonstrate coding techniques and the functionality of Pine Script within a trading context.
Any results from strategies or tools provided are hypothetical, and past performance is not indicative of future results. Trading and investing involve high risk, including the potential loss of principal, and may not be suitable for all individuals. Before making any trading decisions, please consult with a qualified financial professional to understand the risks involved.
By using this script, you acknowledge and agree that any trading decisions are made solely at your discretion and risk.
Enhance your trading precision and confidence 🚀
Happy trading
Chervolino

[blackcat] L1 Value Trend IndicatorOVERVIEW
The L1 Value Trend Indicator is a sophisticated technical analysis tool designed for TradingView users seeking advanced market trend identification and trading signals. This comprehensive indicator combines multiple analytical techniques to provide traders with a holistic view of market dynamics, helping identify potential entry and exit points through various signal mechanisms. 📈 It features a main Value Trend line along with a lagged version, golden cross and dead cross signals, and multiple technical indicators including RSI, Williams %R, Stochastic %K/D, and Relative Strength calculations. The indicator also includes reference levels for support and resistance analysis, making it a versatile tool for both short-term and long-term trading strategies. ✅
FEATURES
📈 Primary Value Trend Line: Calculates a smoothed value trend using a combination of SMA and custom smoothing techniques
🔍 Value Trend Lag: Implements a lagged version of the main trend line for cross-over analysis
🚀 Golden Cross & Dead Cross Signals: Identifies buy/sell opportunities when the main trend line crosses its lagged version
💸 Multi-Indicator Integration: Combines multiple technical analysis tools for comprehensive market view
📊 RSI Calculations: Includes 6-period, 7-period, and 13-period RSI calculations for momentum analysis
📈 Williams %R: Provides overbought/oversold conditions using the Williams %R formula
📉 Stochastic Oscillator: Implements both Stochastic %K and %D calculations for momentum confirmation
📋 Relative Strength: Calculates relative strength based on highest highs and current price
✅ Visual Labels: Displays BUY and SELL labels on chart when crossover conditions are met
📣 Alert Conditions: Provides automated alert conditions for golden cross and dead cross events
📌 Reference Levels: Plots entry (25) and exit (75) reference lines for support/resistance analysis
HOW TO USE
Copy the Script: Copy the complete Pine Script code from the original file
Open TradingView: Navigate to TradingView website or application
Access Pine Editor: Go to the Pine Script editor (usually found in the chart toolbar)
Paste Code: Paste the copied script into the editor
Save Script: Save the script with a descriptive name like " L1 Value Trend Indicator"
Select Chart: Choose the chart where you want to apply the indicator
Add Indicator: Apply the indicator to your chart
Configure Parameters: Adjust input parameters to customize behavior
Monitor Signals: Watch for golden cross (BUY) and dead cross (SELL) signals
Use Reference Levels: Monitor entry (25) and exit (75) lines for support/resistance levels
LIMITATIONS
⚠️ Potential Repainting: The script may repaint due to lookahead bias in some calculations
📉 Lookahead Bias: Some calculations may reference future values, potentially causing repainting issues
🔄 Parameter Sensitivity: Results may vary significantly with different parameter settings
📉 Computational Complexity: May impact chart performance with heavy calculations on large datasets
📊 Resource Usage: Requires significant processing power for multiple indicator calculations
🔄 Data Sensitivity: Results may be affected by data quality and market conditions
NOTES
📈 Signal Timing: Cross-over signals may lag behind actual price movements
📉 Parameter Optimization: Optimal parameters may vary by market conditions and asset type
📋 Market Conditions: Performance may vary significantly across different market environments
📈 Multi-Indicator: Combine signals with other technical indicators for confirmation
📉 Timeframe Analysis: Use multiple timeframes for enhanced signal accuracy
📋 Volume Analysis: Incorporate volume data for additional confirmation
📈 Strategy Integration: Consider using this indicator as part of a broader trading strategy
📉 Risk Management: Use signals as part of a comprehensive risk management approach
📋 Backtesting: Test parameter combinations with historical data before live trading
THANKS
🙏 Original Creator: blackcat1402 creates the L1 Value Trend Indicator
📚 Community Contributions: Recognition to TradingView community for continuous improvements and contributions
📈 Collaborative Development: Appreciation for collaborative efforts in enhancing technical analysis tools
📉 TradingView Community: Special thanks to TradingView community members for their ongoing support and feedback
📋 Educational Resources: Recognition of educational resources that helped in understanding technical analysis principles

BOS FVG IndicatorBOS FVG Indicator (Smart Market Structure Tool)
🔎 Overview
The BOS FVG Indicator is a smart price-action–based tool that combines Break of Structure (BOS), Change of Character (CHoCH), Fair Value Gaps (FVG), Supertrend, and ADX strength into one powerful indicator.
It helps traders identify market structure shifts, imbalances, and high-probability trade setups while also highlighting no-trade zones (NTZ) where the market is choppy or lacks trend strength.
This indicator is designed for intraday and swing traders who follow ICT-style concepts or price-action based trading.
⚡ Key Features
Break of Structure (BOS) & CHoCH Detection
Labels bullish BOS (📈 BOS↑) and bearish BOS (📉 BOS↓).
Highlights structure shifts for trend confirmation.
Fair Value Gaps (FVG)
Auto-detects bullish and bearish FVGs.
Draws transparent boxes with labels where imbalances appear.
Supertrend Confirmation
Adaptive supertrend line with dynamic coloring (green = bullish, red = bearish).
No Trade Zone (NTZ)
Automatically shades background gray when ADX is weak or no BOS detected.
Helps avoid false signals in sideways/choppy markets.
Multi-Timeframe Context
Previous 4H candle range plotted as a dotted yellow box.
Useful for intraday traders tracking HTF liquidity zones.
Signal Strength
Regular and Strong Buy/Sell signals based on ADX confirmation.
Labels include entry info, RR (2:1), and trend strength.
Market Info Dashboard
Table on chart showing ADX strength, current trend, and trade zone status.
🛠 How to Use
Add to Chart → Apply the indicator to any timeframe (works best on 5m–1H for intraday, 4H–Daily for swing).
Choose Mode
Indicator Mode → Shows visual signals, BOS, FVG, NTZ zones, and dashboard.
Strategy Mode → Displays trade entry labels with RR info for backtesting setups.
Filters
Only trade signals when ADX > threshold and NTZ is inactive.
Confirm with Supertrend direction + BOS + FVG alignment.
Entries & Exits
Long Entry → Bullish BOS + Bullish FVG + Trend bullish.
Short Entry → Bearish BOS + Bearish FVG + Trend bearish.
Stop Loss: Recent swing high/low.
Take Profit: Auto-suggested 2:1 RR.
🔔 Alerts
Set alerts to never miss key signals:
✅ Bullish / Bearish BOS
✅ Bullish / Bearish FVG
✅ Strong Buy / Sell
✅ Regular Buy / Sell
✅ Long / Short Entries
✅ No Trade Zone active
Alerts are pre-configured with clear messages (📈, 📉, 🚀, 🟢, 🔴, ⚪).
📌 Best Use Cases
ICT-style liquidity and FVG traders.
Intraday traders filtering strong vs weak signals.
Swing traders using multi-timeframe confirmation.
Traders who want an all-in-one market structure toolkit.
👉 This script is not financial advice. Always backtest before using in live markets.

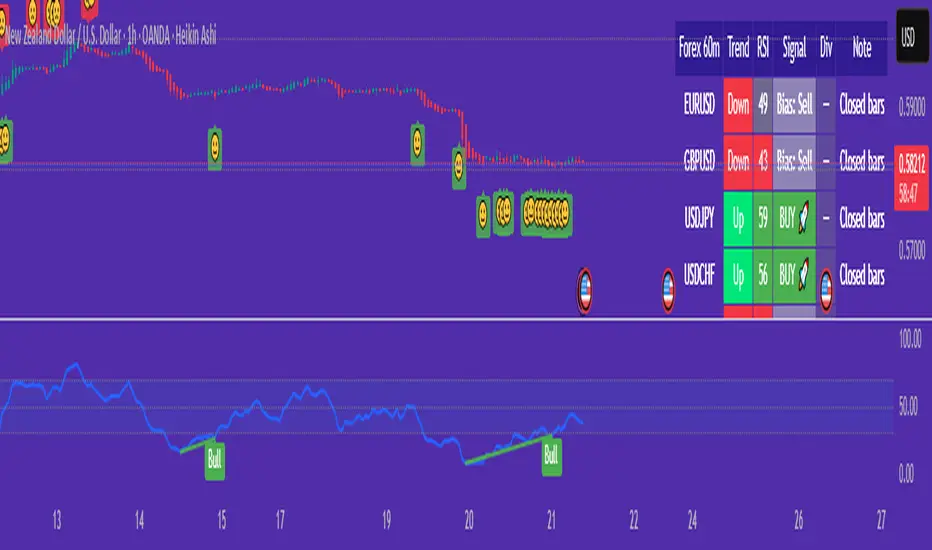
Forex 60m Simple Scanner + RSI Divergence“Forex 60m Simple Scanner + RSI Divergence”
This scanner helps beginner traders quickly identify trade opportunities across the top 10 forex pairs. It combines a simple EMA crossover system with an optional RSI filter to confirm trend direction, and adds RSI divergence detection to spot potential reversals early.
The built-in table shows each pair’s trend, RSI value, buy/sell signal, and divergence status—all in one place.
For beginners, this makes it easier to:
Avoid flipping between multiple charts.
See clear BUY/SELL 🚀 signals instead of guessing.
Spot high-probability setups with RSI divergence markers (😊/☹️).
It simplifies decision-making by turning complex signals into a straightforward dashboard that highlights where attention is needed most.
Forex 5m Simple Scanner + RSI DivergenceHello everyone. this is a easy to use indicator.
I wanted something very easy to visualize and understand. Great for the beginner's.
About this script:
“Forex 5m Simple Scanner + RSI Divergence”
This scanner helps beginner traders quickly identify trade opportunities across the top 10 forex pairs. It combines a simple EMA crossover system with an optional RSI filter to confirm trend direction, and adds RSI divergence detection to spot potential reversals early.
The built-in table shows each pair’s trend, RSI value, buy/sell signal, and divergence status—all in one place.
For beginners, this makes it easier to:
Avoid flipping between multiple charts.
See clear BUY/SELL 🚀 signals instead of guessing.
Spot high-probability setups with RSI divergence markers (😊/☹️).
It simplifies decision-making by turning complex signals into a straightforward dashboard that highlights where attention is needed most.

EMA Oracle and RSIEMA Oracle
- “See the market’s structure through the eyes of exponential wisdom.”
combines classic EMA stacks with Pi-based logic to reveal high-probability buy/sell zones and trend bias across timeframes
Multi-EMA Trend & Pi Signal Indicator
This advanced indicator combines classic trend analysis with Pi-based signal logic to help traders identify optimal entry and exit zones across multiple timeframes.
Core Features
EMA Trend Structure: Displays EMAs 9, 13, 20, 50, and 200 to visualize short-term and long-term trend orientation. Bullish momentum is indicated when shorter EMAs are stacked above longer ones.
Pi-Based Signal Logic: Inspired by the Pi Indicator, it includes EMA111 and EMA700 (350×2) on the daily chart:
Buy Zone: When price is trading below EMA111, it signals potential accumulation for spot or low-leverage position trades.
Sell Zone: When price is above EMA700, it suggests potential distribution or exit zones.
Trend Cross Alerts: Detects EMA crossovers and crossunders to highlight shifts in market structure and generate buy/sell signals.
Multi-Timeframe Analysis: Evaluates trend direction across selected timeframes (e.g., 15m, 30m, 1h, 4h, 1D), offering a broader market perspective.
RSI Integration: Combines Relative Strength Index (RSI) readings with EMA positioning to assess momentum and overbought/oversold conditions.
Trend Table Display: A dynamic table summarizes the asset’s trend status per timeframe, showing:
RSI values
EMA alignment
Overall trend bias (bullish, bearish, neutral)

Swing Support and Resistance [Vijay]Swing-based support & resistance with breakout buy/sell signals and alerts.
Full Description:
The Swing Support and Resistance indicator is a simple yet effective tool to identify swing-based support and resistance levels using pivot points.
Pivot Length: Defines how many bars on each side are used to confirm a swing high (resistance) or swing low (support).
Support & Resistance: Plots the most recent pivot levels as visual markers (circles) on the chart.
Buy & Sell Signals:
A Buy Signal is triggered when price crosses above the last resistance.
A Sell Signal is triggered when price crosses below the last support.
Visual Cues: Arrows are plotted directly on the chart for easy signal recognition.
Alerts: Built-in alert conditions allow you to set TradingView alerts for breakout signals.
This script is useful for traders who rely on price action, breakout trading, and swing structure analysis. It helps quickly spot where price is breaking key levels and provides instant alerts for trade opportunities.
FluidFlow OscillatorFluidFlow Oscillator: Study Material for Traders
Overview
The FluidFlow Oscillator is a custom technical indicator designed to measure price momentum and market flow dynamics by simulating fluid motion concepts such as velocity, viscosity, and turbulence. It helps traders identify potential buy and sell signals along with trend strength, momentum direction, and volatility conditions.
This study explains the underlying calculation concepts, signal logic, visual cues, and how to interpret the professional dashboard table that summarizes key indicator readings.
________________________________________
How the FluidFlow Oscillator Works
Core Mechanisms
1. Price Flow Velocity
o Measures the rate of change of price over a specified flow length (default 40 bars).
o Calculated as a percentage change of closing price: roc=close−closelen_flowcloselen_flow×100\text{roc} = \frac{\text{close} - \text{close}_{len\_flow}}{\text{close}_{len\_flow}} \times 100roc=closelen_flowclose−closelen_flow×100
o Smoothed by an EMA (Exponential Moving Average) to reduce noise, generating a "flow velocity" value.
2. Viscosity Factor
o Analogous to fluid viscosity, it adjusts the flow velocity based on recent price volatility.
o Volatility is computed as the standard deviation of close prices over the flow length.
o The viscosity acts as a damping factor to slow down the flow velocity in highly volatile conditions.
o This results in a "flow with viscosity" value, that smooths out the velocity considering market turbulence.
3. Turbulence Burst
o Captures sudden changes or bursts in the flow by measuring changes between successive viscosity-adjusted flows.
o The turbulence value is a smoothed absolute change in flow.
o A burst boost factor is added to the oscillator to incorporate this rapid change component, amplifying signals during sudden shifts.
4. Oscillator Calculation
o The raw oscillator value is the sum of flow with viscosity plus burst boost, scaled by 10.
o Clamped between -100 and +100 to limit extremes.
o Finally, smoothed again by EMA for cleaner visualization.
________________________________________
Signal Logic
The oscillator works with complementary components to produce actionable signals:
• Signal Line: An EMA-smoothed version of the oscillator for generating crossover-based signals.
• Momentum: The rate of change of the oscillator itself, smoothed by EMA.
• Trend: Uses fast (21-period EMA) and slow (50-period EMA) moving averages of price to identify market trend direction (uptrend, downtrend, or sideways).
Signal Conditions
• Bullish Signal (Buy): Oscillator crosses above the oversold threshold with positive momentum.
• Bearish Signal (Sell): Oscillator crosses below the overbought threshold with negative momentum.
Statuses
The oscillator provides descriptive market states based on level and momentum:
• Overbought
• Oversold
• Buy Signal
• Sell Signal
• Bullish / Bearish (momentum-driven)
• Neutral (no clear trend)
________________________________________
Color System and Visualization
The oscillator uses a sophisticated HSV color model adapting hues according to:
• Oscillator value magnitude and sign (positive or negative)
• Acceleration of oscillator changes
• Smooth color gradients to facilitate intuitive understanding of trend strength and momentum shifts
Background colors highlight overbought (red tint) and oversold (green tint) zones with transparency.
________________________________________
How to Understand the Professional Dashboard Table
The FluidFlow Oscillator offers an integrated table at the bottom center of the chart. This dashboard summarizes critical indicator readings in 8 columns across 3 rows:
Column Description
SIGNAL Current signal status (e.g., Buy, Sell, Overbought) with color coding
OSCILLATOR Current oscillator value (-100 to +100) with color reflecting intensity and direction
MOMENTUM Momentum bias indicating strength/direction of oscillator changes (Strong Up, Up, Sideways, Down, Strong Down)
TREND Current trend status based on EMAs (Strong Uptrend, Uptrend, Sideways, Downtrend, Strong Downtrend)
VOLATILITY Volatility percentage relative to average, indicating market activity level
FLOW Flow velocity value describing price momentum magnitude and direction
TURBULENCE Turbulence level indicating sudden bursts or spikes in price movement
PROGRESS Oscillator's position mapped as a percentage (0% to 100%) showing proximity to extreme levels
Rows Explained
• Row 1 (Header): Labels for each metric.
• Row 2 (Values): Current numerical or descriptive values color-coded along a professional scheme:
o Green or lime tones indicate positive or bullish conditions.
o Red or orange tones indicate caution, sell signals, or bearish conditions.
o Blue tones indicate neutral or stable conditions.
• Row 3 (Status Indicators): Emoji-like icons and bars provide a quick visual gauge of each metric's intensity or signal strength:
o For example, "🟢🟢🟢" suggests very strong bullish momentum, while "🔴🔴🔴" suggests strong bearish momentum.
o Progress bar visually demonstrates oscillator movement toward oversold or overbought extremes.
________________________________________
Practical Interpretation Tips
• A Buy signal with green colors and strong momentum usually precedes upward price moves.
• An Overbought status with red background and red table colors warns of potential price corrections or reversals.
• Watch the Turbulence to gauge market instability; spikes may precede price shocks or volatility bursts.
• Confirm signals with the Trend and Momentum columns to avoid false entries.
• Use the Progress bar to anticipate oscillations approaching key threshold levels for timing trades.
________________________________________
Alerts
The oscillator supports alerts for:
• Buy and sell signals based on oscillator crossovers.
• Overbought and oversold levels reached.
These help traders automate awareness of important market conditions.
________________________________________
Disclaimer
The FluidFlow Oscillator and its signals are for educational and informational purposes only. They do not guarantee profits and should not be considered as financial advice. Always conduct your own research and use proper risk management when trading. Past performance is not indicative of future results.
________________________________________
This detailed explanation should help you understand the workings of the FluidFlow Oscillator, its components, signal logic, and how to analyze its professional dashboard for informed trading decisions.

Daily Buy/Sell Triggers + ATR TargetsThis tool gives you a once-per-day, objective ATR map: Buy Trigger above the open, Sell Trigger below the open, clean ATR targets, and FULL ATR extremes. It’s designed for clarity, precision, and zero intraday repainting so you can plan the session and execute with confidence.
This indicator prints a new, static grid of intraday levels every New York 18:00 (end of the NY trading day). The grid is anchored at the day’s open and spaced by the Daily ATR so you get tick-precise Buy Trigger, Sell Trigger, intermediate ATR targets, and the FULL ATR bounds for the session.
The levels act as objective support/resistance and intraday measuring sticks for continuation, mean-reversion, and range expansion trades.
What you see on the chart
A thin midline at the Daily Open (anchor).
Green lines above, red lines below, spaced at your chosen ATR multiples.
Text at the far right for:
Buy trigger
Sell trigger
FULL ATR (both sides)
Intermediate targets are unlabeled to keep the chart clean (they’re still tradable S/R).
Locked 5m 13 EMA & 15m 20 EMA with Mid EMA & SignalsThis indicator overlays the 5-minute 13 EMA and the 15-minute 20 EMA on any chart timeframe up to 15 minutes, along with a mid EMA (5-minute 36-period) for reference.
Features include:
EMA Cross Detection: Shows bullish and bearish cross arrows when the 5m 13 EMA crosses the 15m 20 EMA.
EMA Fill: Highlights the area between the EMAs in green (bullish) or red (bearish).
Mid EMA Buy/Sell Signals: Generates buy signals when price touches the mid EMA in a bullish stack and sell signals in a bearish stack.
Custom Alerts: Alerts for EMA crosses, EMA stack direction, and mid EMA buy/sell triggers.
Timeframe Safety Warning: Alerts if applied on timeframes higher than 15 minutes.
Ideal For:
Traders who want a locked, non-repainting EMA setup for multi-timeframe analysis and clear entry/exit signals based on mid-range EMA interaction.
Inputs:
Show/Hide arrows for EMA crosses
Show/Hide fill between EMAs
Show/Hide mid EMA line
Show/Hide buy/sell signals
Fill transparency adjustment
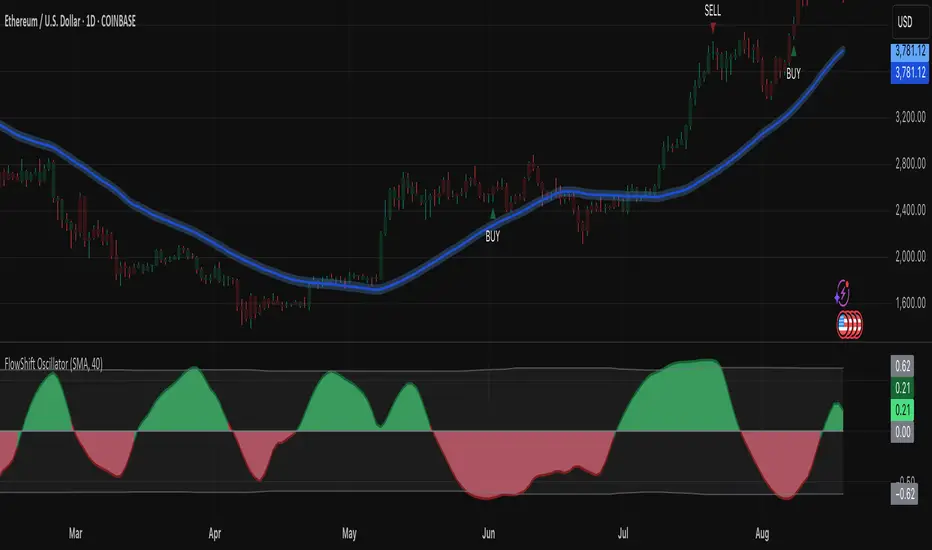
FlowShift OscillatorFlowShift Oscillator
Overview
The FlowShift Oscillator is a sophisticated momentum indicator designed to capture short-term shifts in market strength, identify trend acceleration, and highlight potential reversals. Combining baseline trend analysis with normalized momentum displacement and volatility-adjusted thresholds, FlowShift provides traders with a responsive, adaptive, and visually intuitive tool suitable for multiple timeframes and asset classes. Whether used for intraday scalping or longer-term trend following, FlowShift helps traders make informed decisions with precision and confidence.
Features
Customizable Baseline Moving Average : Select from SMA, EMA, SMMA (RMA), WMA, or VWMA to define the underlying trend. Adjustable length allows for tuning to specific market conditions.
Normalized Momentum Calculation : Measures price displacement relative to the baseline MA, removing minor fluctuations while preserving meaningful momentum shifts.
Volatility-Adjusted Thresholds : Dynamic upper and lower bounds adapt to market volatility, helping identify overextended bullish or bearish conditions.
Optional Signal Markers : Buy/Sell triangles indicate potential turning points when momentum reaches critical levels, aiding trade timing and decision-making.
Visual Enhancements : Customizable area fills, line colors, and optional candle tinting allow traders to quickly interpret momentum, bias, and trend direction.
Flexible Timeframe Compatibility : Effective across all timeframes, from 1-minute intraday charts to daily and weekly analysis.
How It Works
FlowShift calculates the displacement of price from a baseline moving average to identify deviations from the prevailing trend. This displacement is normalized and smoothed using exponential moving averages, producing a clean oscillator line that highlights genuine momentum changes. The oscillator’s dynamic thresholds are determined by a percentile of recent absolute values, providing an adaptive reference for extreme conditions in both bullish and bearish markets.
Signals
Buy Signal : Triggered when the oscillator crosses above prior lows in an oversold region, suggesting potential upward momentum.
Sell Signal : Triggered when the oscillator crosses below prior highs in an overbought region, indicating potential downward momentum.
Signals are optional and can be displayed as triangles on the chart to clearly mark potential entry and exit points.
Visual Interpretation
FlowShift Line & Area : The oscillator line and area highlight momentum direction and intensity. Upward momentum is shown in green tones, downward momentum in red.
Baseline MA & Glow : Displays the selected baseline moving average with optional glow for trend reference.
Candle Tinting : Optionally tints bars based on the baseline MA bias, providing an at-a-glance view of market sentiment.
Usage Notes
FlowShift is best used in conjunction with other trend confirmation tools or support/resistance analysis.
Dynamic thresholds help identify potential reversal points, but traders should consider overall market context and not rely solely on signals.
Customize the baseline MA type and length to fit your trading style; shorter lengths increase sensitivity, while longer lengths provide smoother trend representation.
Use the optional signal markers as guidance for trade timing, combining with risk management strategies for optimal results.
Conclusion
FlowShift Oscillator delivers a powerful, adaptive, and visually intuitive approach to momentum analysis. By combining baseline trend assessment, normalized momentum, and dynamic volatility scaling, it enables traders to anticipate market shifts, spot trend accelerations, and make timely trading decisions across a wide range of markets and timeframes.
Machine Learning BBPct [BackQuant]Machine Learning BBPct
What this is (in one line)
A Bollinger Band %B oscillator enhanced with a simplified K-Nearest Neighbors (KNN) pattern matcher. The model compares today’s context (volatility, momentum, volume, and position inside the bands) to similar situations in recent history and blends that historical consensus back into the raw %B to reduce noise and improve context awareness. It is informational and diagnostic—designed to describe market state, not to sell a trading system.
Background: %B in plain terms
Bollinger %B measures where price sits inside its dynamic envelope: 0 at the lower band, 1 at the upper band, ~ 0.5 near the basis (the moving average). Readings toward 1 indicate pressure near the envelope’s upper edge (often strength or stretch), while readings toward 0 indicate pressure near the lower edge (often weakness or stretch). Because bands adapt to volatility, %B is naturally comparable across regimes.
Why add (simplified) KNN?
Classic %B is reactive and can be whippy in fast regimes. The simplified KNN layer builds a “nearest-neighbor memory” of recent market states and asks: “When the market looked like this before, where did %B tend to be next bar?” It then blends that estimate with the current %B. Key ideas:
• Feature vector . Each bar is summarized by up to five normalized features:
– %B itself (normalized)
– Band width (volatility proxy)
– Price momentum (ROC)
– Volume momentum (ROC of volume)
– Price position within the bands
• Distance metric . Euclidean distance ranks the most similar recent bars.
• Prediction . Average the neighbors’ prior %B (lagged to avoid lookahead), inverse-weighted by distance.
• Blend . Linearly combine raw %B and KNN-predicted %B with a configurable weight; optional filtering then adapts to confidence.
This remains “simplified” KNN: no training/validation split, no KD-trees, no scaling beyond windowed min-max, and no probabilistic calibration.
How the script is organized (by input groups)
1) BBPct Settings
• Price Source – Which price to evaluate (%B is computed from this).
• Calculation Period – Lookback for SMA basis and standard deviation.
• Multiplier – Standard deviation width (e.g., 2.0).
• Apply Smoothing / Type / Length – Optional smoothing of the %B stream before ML (EMA, RMA, DEMA, TEMA, LINREG, HMA, etc.). Turning this off gives you the raw %B.
2) Thresholds
• Overbought/Oversold – Default 0.8 / 0.2 (inside ).
• Extreme OB/OS – Stricter zones (e.g., 0.95 / 0.05) to flag stretch conditions.
3) KNN Machine Learning
• Enable KNN – Switch between pure %B and hybrid.
• K (neighbors) – How many historical analogs to blend (default 8).
• Historical Period – Size of the search window for neighbors.
• ML Weight – Blend between raw %B and KNN estimate.
• Number of Features – Use 2–5 features; higher counts add context but raise the risk of overfitting in short windows.
4) Filtering
• Method – None, Adaptive, Kalman-style (first-order),
or Hull smoothing.
• Strength – How aggressively to smooth. “Adaptive” uses model confidence to modulate its alpha: higher confidence → stronger reliance on the ML estimate.
5) Performance Tracking
• Win-rate Period – Simple running score of past signal outcomes based on target/stop/time-out logic (informational, not a robust backtest).
• Early Entry Lookback – Horizon for forecasting a potential threshold cross.
• Profit Target / Stop Loss – Used only by the internal win-rate heuristic.
6) Self-Optimization
• Enable Self-Optimization – Lightweight, rolling comparison of a few canned settings (K = 8/14/21 via simple rules on %B extremes).
• Optimization Window & Stability Threshold – Governs how quickly preferred K changes and how sensitive the overfitting alarm is.
• Adaptive Thresholds – Adjust the OB/OS lines with volatility regime (ATR ratio), widening in calm markets and tightening in turbulent ones (bounded 0.7–0.9 and 0.1–0.3).
7) UI Settings
• Show Table / Zones / ML Prediction / Early Signals – Toggle informational overlays.
• Signal Line Width, Candle Painting, Colors – Visual preferences.
Step-by-step logic
A) Compute %B
Basis = SMA(source, len); dev = stdev(source, len) × multiplier; Upper/Lower = Basis ± dev.
%B = (price − Lower) / (Upper − Lower). Optional smoothing yields standardBB .
B) Build the feature vector
All features are min-max normalized over the KNN window so distances are in comparable units. Features include normalized %B, normalized band width, normalized price ROC, normalized volume ROC, and normalized position within bands. You can limit to the first N features (2–5).
C) Find nearest neighbors
For each bar inside the lookback window, compute the Euclidean distance between current features and that bar’s features. Sort by distance, keep the top K .
D) Predict and blend
Use inverse-distance weights (with a strong cap for near-zero distances) to average neighbors’ prior %B (lagged by one bar). This becomes the KNN estimate. Blend it with raw %B via the ML weight. A variance of neighbor %B around the prediction becomes an uncertainty proxy ; combined with a stability score (how long parameters remain unchanged), it forms mlConfidence ∈ . The Adaptive filter optionally transforms that confidence into a smoothing coefficient.
E) Adaptive thresholds
Volatility regime (ATR(14) divided by its 50-bar SMA) nudges OB/OS thresholds wider or narrower within fixed bounds. The aim: comparable extremeness across regimes.
F) Early entry heuristic
A tiny two-step slope/acceleration probe extrapolates finalBB forward a few bars. If it is on track to cross OB/OS soon (and slope/acceleration agree), it flags an EARLY_BUY/SELL candidate with an internal confidence score. This is explicitly a heuristic—use as an attention cue, not a signal by itself.
G) Informational win-rate
The script keeps a rolling array of trade outcomes derived from signal transitions + rudimentary exits (target/stop/time). The percentage shown is a rough diagnostic , not a validated backtest.
Outputs and visual language
• ML Bollinger %B (finalBB) – The main line after KNN blending and optional filtering.
• Gradient fill – Greenish tones above 0.5, reddish below, with intensity following distance from the midline.
• Adaptive zones – Overbought/oversold and extreme bands; shaded backgrounds appear at extremes.
• ML Prediction (dots) – The KNN estimate plotted as faint circles; becomes bright white when confidence > 0.7.
• Early arrows – Optional small triangles for approaching OB/OS.
• Candle painting – Light green above the midline, light red below (optional).
• Info panel – Current value, signal classification, ML confidence, optimized K, stability, volatility regime, adaptive thresholds, overfitting flag, early-entry status, and total signals processed.
Signal classification (informational)
The indicator does not fire trade commands; it labels state:
• STRONG_BUY / STRONG_SELL – finalBB beyond extreme OS/OB thresholds.
• BUY / SELL – finalBB beyond adaptive OS/OB.
• EARLY_BUY / EARLY_SELL – forecast suggests a near-term cross with decent internal confidence.
• NEUTRAL – between adaptive bands.
Alerts (what you can automate)
• Entering adaptive OB/OS and extreme OB/OS.
• Midline cross (0.5).
• Overfitting detected (frequent parameter flipping).
• Early signals when early confidence > 0.7.
These are purely descriptive triggers around the indicator’s state.
Practical interpretation
• Mean-reversion context – In range markets, adaptive OS/OB with ML smoothing can reduce whipsaws relative to raw %B.
• Trend context – In persistent trends, the KNN blend can keep finalBB nearer the mid/upper region during healthy pullbacks if history supports similar contexts.
• Regime awareness – Watch the volatility regime and adaptive thresholds. If thresholds compress (high vol), “OB/OS” comes sooner; if thresholds widen (calm), it takes more stretch to flag.
• Confidence as a weight – High mlConfidence implies neighbors agree; you may rely more on the ML curve. Low confidence argues for de-emphasizing ML and leaning on raw %B or other tools.
• Stability score – Rising stability indicates consistent parameter selection and fewer flips; dropping stability hints at a shifting backdrop.
Methodological notes
• Normalization uses rolling min-max over the KNN window. This is simple and scale-agnostic but sensitive to outliers; the distance metric will reflect that.
• Distance is unweighted Euclidean. If you raise featureCount, you increase dimensionality; consider keeping K larger and lookback ample to avoid sparse-neighbor artifacts.
• Lag handling intentionally uses neighbors’ previous %B for prediction to avoid lookahead bias.
• Self-optimization is deliberately modest: it only compares a few canned K/threshold choices using simple “did an extreme anticipate movement?” scoring, then enforces a stability regime and an overfitting guard. It is not a grid search or GA.
• Kalman option is a first-order recursive filter (fixed gain), not a full state-space estimator.
• Hull option derives a dynamic length from 1/strength; it is a convenience smoothing alternative.
Limitations and cautions
• Non-stationarity – Nearest neighbors from the recent window may not represent the future under structural breaks (policy shifts, liquidity shocks).
• Curse of dimensionality – Adding features without sufficient lookback can make genuine neighbors rare.
• Overfitting risk – The script includes a crude overfitting detector (frequent parameter flips) and will fall back to defaults when triggered, but this is only a guardrail.
• Win-rate display – The internal score is illustrative; it does not constitute a tradable backtest.
• Latency vs. smoothness – Smoothing and ML blending reduce noise but add lag; tune to your timeframe and objectives.
Tuning guide
• Short-term scalping – Lower len (10–14), slightly lower multiplier (1.8–2.0), small K (5–8), featureCount 3–4, Adaptive filter ON, moderate strength.
• Swing trading – len (20–30), multiplier ~2.0, K (8–14), featureCount 4–5, Adaptive thresholds ON, filter modest.
• Strong trends – Consider higher adaptive_upper/lower bounds (or let volatility regime do it), keep ML weight moderate so raw %B still reflects surges.
• Chop – Higher ML weight and stronger Adaptive filtering; accept lag in exchange for fewer false extremes.
How to use it responsibly
Treat this as a state descriptor and context filter. Pair it with your execution signals (structure breaks, volume footprints, higher-timeframe bias) and risk management. If mlConfidence is low or stability is falling, lean less on the ML line and more on raw %B or external confirmation.
Summary
Machine Learning BBPct augments a familiar oscillator with a transparent, simplified KNN memory of recent conditions. By blending neighbors’ behavior into %B and adapting thresholds to volatility regime—while exposing confidence, stability, and a plain early-entry heuristic—it provides an informational, probability-minded view of stretch and reversion that you can interpret alongside your own process.

Multi-Band Trend LineThis Pine Script creates a versatile technical indicator called "Multi-Band Trend Line" that builds upon the concept of the popular "Follow Line Indicator" by Dreadblitz. While the original Follow Line Indicator uses simple trend detection to place a line at High or Low levels, this enhanced version combines multiple band-based trading strategies with dynamic trend line generation. The indicator supports five different band types and provides more sophisticated buy/sell signals based on price breakouts from various technical analysis bands.
Key Features
Multi-Band Support
The indicator supports five different band types:
- Bollinger Bands: Uses standard deviation to create bands around a moving average
- Keltner Channels: Uses ATR (Average True Range) to create bands around a moving average
- Donchian Channels: Uses the highest high and lowest low over a specified period
- Moving Average Envelopes: Creates bands as a percentage above and below a moving average
- ATR Bands: Uses ATR multiplier to create bands around a moving average
Dynamic Trend Line Generation (Enhanced Follow Line Concept)
- Similar to the Follow Line Indicator, the trend line is placed at High or Low levels based on trend direction
- Key Enhancement: Instead of simple trend detection, this version uses band breakouts to trigger trend changes
- When price breaks above the upper band (bullish signal), the trend line is set to the low (optionally adjusted with ATR) - similar to Follow Line's low placement
- When price breaks below the lower band (bearish signal), the trend line is set to the high (optionally adjusted with ATR) - similar to Follow Line's high placement
- The trend line acts as dynamic support/resistance, following the price action more precisely than the original Follow Line
ATR Filter (Follow Line Enhancement)
- Like the original Follow Line Indicator, an ATR filter can be selected to place the line at a more distance level than the normal mode settled at candles Highs/Lows
- When enabled, it adds/subtracts ATR value to provide more conservative trend line placement
- Helps reduce false signals in volatile markets
- This feature maintains the core philosophy of the Follow Line while adding more precision through band-based triggers
Signal Generation
- Buy Signal: Generated when trend changes from bearish to bullish (trend line starts rising)
- Sell Signal: Generated when trend changes from bullish to bearish (trend line starts falling)
- Signals are displayed as labels on the chart
Visual Elements
- Upper and lower bands are plotted in gray
- Trend line changes color based on direction (green for bullish, red for bearish)
- Background color changes based on trend direction
- Buy/sell signals are marked with labeled shapes
How It Works
Band Calculation: Based on the selected band type, upper and lower boundaries are calculated
Signal Detection: When price closes above the upper band or below the lower band, a breakout signal is generated
Trend Line Update: The trend line is updated based on the breakout direction and previous trend line value
Trend Direction: Determined by comparing current trend line with the previous value
Alert Generation: Buy/sell conditions trigger alerts and visual signals
Use Cases
Enhanced trend following strategies: More precise than basic Follow Line due to band-based triggers
Breakout trading: Multiple band types provide various breakout opportunities
Dynamic support/resistance identification: Combines Follow Line concept with band analysis
Multi-timeframe analysis with different band types: Choose the most suitable band for your timeframe
Reduced false signals: Band confirmation provides better entry/exit points compared to simple trend following

Volatility Zones (VStop + Bands) — Fixed (v2)📝 What this indicator is
This script is called “Volatility Zones (VStop + Bands)”.
It is an ATR-based volatility indicator that combines dynamic volatility bands, a Volatility Stop line (VStop), and volatility spike detection into a single tool.
Unlike moving average–based indicators, this tool does not rely on averages of price direction. Instead, it measures the market’s true volatility and reacts to expansions or contractions in price ranges.
________________________________________
⚙️ How it is built
The indicator uses several volatility-based components:
1. Average True Range (ATR)
o ATR is calculated over a user-defined length.
o It measures how much price typically moves in a given number of bars, making it the foundation of this indicator.
2. Volatility Bands
o Upper band = close + ATR × factor
o Lower band = close - ATR × factor
o The area between them is shaded.
o This gives traders an immediate visual sense of market volatility width — wide bands = high volatility, narrow bands = quiet market.
3. Volatility Stop (VStop)
o A stateful trailing stop based on ATR.
o It tracks the highest (or lowest) price in the current trend and places a stop offset by ATR × multiplier.
o When price crosses this stop, the indicator flips trend direction.
o This creates a dynamic stop-and-reverse mechanism that adapts to volatility.
4. Trend Zones
o When the trend is bullish, the stop is green and the chart background is shaded softly green.
o When bearish, the stop is red and the background is shaded softly red.
o This makes the market’s directional bias visually clear at all times.
5. Flip Signals (Buy/Sell Arrows)
o Whenever the VStop flips, arrows appear:
Green BUY arrows below price when the trend turns bullish.
Red SELL arrows above price when the trend turns bearish.
o These are also tied to built-in alerts for automation.
6. Volatility Spike Detection
o The script compares current ATR to its recent average.
o If ATR suddenly expands above a threshold, a small yellow “VOL” marker appears at the top of the chart.
o This highlights potential breakout phases or unusual volatility events.
7. Stop Labels
o At every trend flip, a small label appears at the bar, showing the exact stop level.
o This makes it easy to use the stop as a reference for risk management.
________________________________________
📊 How it works in practice
• When price is above the VStop line, the market is considered in an uptrend.
• When price is below the VStop line, the market is in a downtrend.
• The bands expand/contract with volatility, helping traders gauge risk and position sizing.
• Flip arrows signal when trend direction changes.
• Volatility spikes warn traders that the market is entering a higher-risk phase, often before strong moves.
________________________________________
🎯 How it may help traders
• Trend following → Helps traders identify whether the market is trending up or down.
• Stop placement → Provides a dynamic stop level that adjusts to volatility.
• Volatility awareness → Shaded bands and spike markers show when the market is likely to become unstable.
• Trade timing → Flip arrows and labels help identify potential entry or exit points.
• Risk management → Wide bands indicate higher risk; narrow bands suggest safer, tighter ranges.
________________________________________
🌍 In what markets it is useful
Because the indicator is based purely on volatility, it works across all asset classes and timeframes:
• Stocks & ETFs → Helps identify breakouts and long-term trends.
• Forex → Very useful in spot FX where volatility shifts frequently.
• Crypto → ATR reacts strongly to high volatility, helping traders adapt stops dynamically.
• Futures & Commodities → Great for tracking trending commodities and managing risk.
Scalpers, swing traders, and position traders can all benefit by adjusting the ATR length and multipliers to suit their trading style.
________________________________________
💡 Originality of this script
This is not just a mashup of existing indicators. It integrates:
• ATR-based Volatility Bands for context,
• A stateful Volatility Stop (adapted and rewritten cleanly),
• Flip arrows and labels for actionable trading signals,
• Volatility spike detection to highlight regime shifts.
The result is a comprehensive volatility-aware trading tool that goes beyond just plotting ATR or trend stops.
________________________________________
🔔 Alerts
• Buy Flip → triggers when the trend changes bullish.
• Sell Flip → triggers when the trend changes bearish.
Traders can connect these alerts to automated strategies, bots, or notification systems.

NAS100 Component Sentiment Scanner# NAS100 Component Sentiment Scanner
## 🎯 Overview
The NAS100 Component Sentiment Scanner analyzes the top-weighted stocks in the NASDAQ-100 index to provide real-time bullish/bearish sentiment signals that can help predict NAS100 price movements. This indicator combines multiple technical analysis methods to give traders a comprehensive view of underlying market sentiment.
## 📊 How It Works
The indicator calculates sentiment scores for major NASDAQ-100 components (AAPL, MSFT, NVDA, GOOGL, AMZN, META, TSLA, AVGO, COST, NFLX) using:
- **RSI Analysis**: Identifies overbought/oversold conditions
- **Moving Average Trends**: Compares fast vs slow MA positioning
- **Volume Confirmation**: Validates moves with volume thresholds
- **Price Momentum**: Analyzes recent price direction
- **Market Cap Weighting**: Uses actual NASDAQ-100 weightings for accuracy
## 🚀 Key Features
### Real-Time Sentiment Analysis
- Weighted composite score based on individual stock analysis
- Color-coded sentiment line (Green = Bullish, Red = Bearish)
- Dynamic background coloring for strong signals
### Interactive Data Table
- Shows individual stock scores and signals
- Bullish/Bearish stock count summary
- Customizable position and size
### Smart Signal System
- **Bullish Signals**: Green triangle up when sentiment crosses threshold
- **Bearish Signals**: Red triangle down when sentiment falls below threshold
- **Alert Conditions**: Automatic notifications for signal changes
## ⚙️ Customization Options
### Technical Analysis Settings
- **RSI Period**: Adjust lookback period (default: 14)
- **RSI Levels**: Set overbought/oversold thresholds
- **Moving Averages**: Configure fast/slow MA periods
- **Volume Threshold**: Set volume confirmation multiplier
### Signal Thresholds
- **Bullish/Bearish Levels**: Customize trigger points
- **Strong Signal Levels**: Set extreme sentiment thresholds
- Fine-tune sensitivity to market conditions
### Display Options
- **Toggle Table**: Show/hide sentiment data table
- **Table Position**: 6 position options (Top/Bottom/Middle + Left/Right)
- **Table Size**: Choose from Tiny, Small, Normal, or Large
- **Background Colors**: Enable/disable signal backgrounds
- **Signal Arrows**: Show/hide buy/sell indicators
### Stock Selection
- **Individual Control**: Enable/disable any of the 10 major stocks
- **Dynamic Weighting**: Automatically adjusts calculations based on selected stocks
- **Flexible Analysis**: Focus on specific sectors or market leaders
## 📈 How to Use
### 1. Basic Setup
1. Add the indicator to your NAS100 chart
2. Default settings work well for most traders
3. Observe the sentiment line and signals
### 2. Signal Interpretation
- **Score > 30**: Bullish bias for NAS100
- **Score > 50**: Strong bullish signal
- **Score -30 to 30**: Neutral/consolidation
- **Score < -30**: Bearish bias for NAS100
- **Score < -50**: Strong bearish signal
### 3. Trading Strategies
**Trend Following:**
- Buy NAS100 when bullish signals appear
- Sell/short when bearish signals trigger
- Use background colors for quick visual confirmation
**Divergence Trading:**
- Watch for sentiment/price divergences
- Strong sentiment with weak NAS100 price = potential breakout
- Weak sentiment with strong NAS100 price = potential reversal
**Consensus Trading:**
- Monitor bullish/bearish stock counts in table
- 8+ stocks aligned = strong directional bias
- Mixed signals = wait for clearer consensus
### 4. Advanced Usage
- Combine with your existing NAS100 trading strategy
- Use multiple timeframes for confirmation
- Adjust thresholds based on market volatility
- Focus on specific stocks by disabling others
## 🔔 Alert Setup
The indicator includes built-in alert conditions:
1. Go to TradingView Alerts
2. Select "NAS100 Component Sentiment Scanner"
3. Choose from available alert types:
- NAS100 Bullish Signal
- NAS100 Bearish Signal
- Strong Bullish Consensus
- Strong Bearish Consensus
## 💡 Pro Tips
### Optimization
- **High Volatility**: Increase signal thresholds (±40, ±60)
- **Low Volatility**: Decrease thresholds (±20, ±40)
- **Day Trading**: Use smaller table, focus on real-time signals
- **Swing Trading**: Enable background colors, larger thresholds
### Best Practices
- Don't use as a standalone system - combine with price action
- Check individual stock table for context
- Monitor during market open for most reliable signals
- Consider earnings seasons for individual stock impacts
### Market Conditions
- **Trending Markets**: Higher accuracy, use with trend following
- **Ranging Markets**: Watch for false signals, increase thresholds
- **News Events**: Individual stock news can skew sentiment temporarily
## 🎨 Visual Guide
- **Green Line Above Zero**: Bullish sentiment building
- **Red Line Below Zero**: Bearish sentiment building
- **Background Color Changes**: Strong signal confirmation
- **Triangle Arrows**: Entry/exit signal points
- **Table Colors**: Quick sentiment overview
## ⚠️ Important Notes
- This indicator analyzes component stocks, not NAS100 directly
- Market cap weightings approximate real NASDAQ-100 weightings
- Sentiment can change rapidly during volatile periods
- Always use proper risk management
- Combine with other technical analysis tools
## 🔧 Troubleshooting
- **No signals**: Check if thresholds are too extreme
- **Too many signals**: Increase threshold sensitivity
- **Table not showing**: Ensure "Show Sentiment Table" is enabled
- **Missing stocks**: Verify individual stock toggles in settings
---
**Suitable for**: Day traders, swing traders, NAS100 specialists, index traders
**Best Timeframes**: 5min, 15min, 1H, 4H
**Market Sessions**: US market hours for highest accuracy

Recommendation Indicatorالوصف بالعربية
استراتيجية تداول مبنية على ٦ مؤشرات تأكيدية لرصد حركة السوق واتجاهه.
تعتمد على عدّ الشموع الصاعدة والهابطة المتتالية كعامل أساسي، وتدمج معها مؤشرات إضافية للتأكيد.
عند توافق المؤشرات معًا، يتم توليد إشارة شراء (BUY) أو بيع (SELL) واضحة على الرسم البياني.
هذا يعزز دقة الإشارات ويقلل من التذبذبات أو الإشارات الكاذبة، مما يجعلها مناسبة للمتداولين الباحثين عن قوة الاتجاه وتأكيده قبل الدخول في الصفقة.
🔎 ملاحظات الاستخدام
الاستراتيجية تحتوي على ٦ أدوات تأكيد مجتمعة لضمان إشارات أدق.
يُفضل استخدامها مع اختبار رجعي (Backtesting) قبل التداول الفعلي.
يمكن تعديل إعدادات المؤشرات لتناسب السوق أو الإطار الزمني المستخدم.
لا تعتبر توصية مالية مباشرة، وإنما أداة تعليمية وتجريبية.
---
📌 Description in English
A trading strategy built on 6 confirmation indicators to track market movements and trends.
It uses consecutive up and down bars as the core logic, combined with additional indicators for confirmation.
When all confirmations align, the strategy generates clear BUY or SELL signals on the chart.
This approach improves signal accuracy, reduces noise, and helps traders confirm market direction before entering a trade.
🔎 Usage Notes
The strategy incorporates 6 confirmation tools working together for higher accuracy.
Backtesting is recommended before applying it to live trading.
Indicator parameters can be adjusted to fit different markets and timeframes.
This is not financial advice, but an educational and experimental tool.
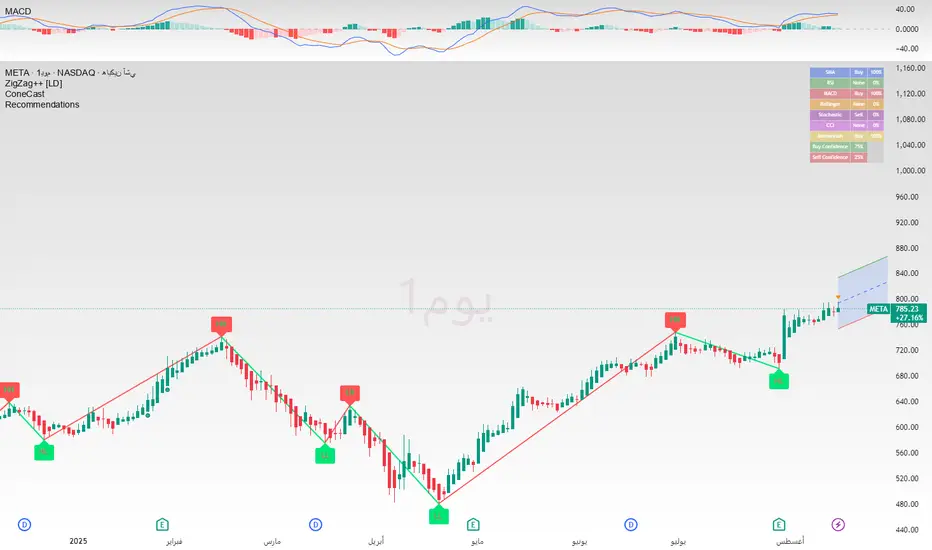
